The Big Picture
The lifecycle of an event in Sentry is a complex process which involves many components. Dynamic Sampling is one of these components, and it is important to understand how it fits into the bigger picture.

Sequencing
Dynamic Sampling occurs at the edge of our ingestion pipeline, precisely in Relay.
When transaction events arrive, in a simplified model, they go through the following steps (some of which won't apply if you self-host Sentry):
- Inbound data filters: every transaction runs through inbound data filters as configured in project settings, such as legacy browsers or denied releases. Transactions dropped here do not count for quota and are not included in “total transactions” data.
- Quota enforcement: Sentry charges for all further transactions sent in, before events are passed on to dynamic sampling.
- Metrics extraction: after passing quotas, Sentry extracts metrics from the total incoming transactions. These metrics provide granular numbers for the performance and frequency of every application transaction.
- Dynamic Sampling: based on an internal set of rules, Relay determines a sample rate for every incoming transaction event. A random number generator finally decides whether this payload should be kept or dropped.
- Rate limiting: transactions that are sampled by Dynamic Sampling will be stored and indexed. To protect the infrastructure, internal rate limits apply at this point. Under normal operation, this rate limit is never reached since dynamic sampling already reduces the volume of stored events.
💡 Example
A client is sending 1000 transactions per second to Sentry:
- 100 transactions per second are from old browsers and get dropped through an inbound data filter.
- The remaining 900 transactions per second show up as total transactions in Sentry.
- Their current overall sample rate is at 20%, which statistically samples 180 transactions per second.
- Since this is above the 100/s limit, about 80 transactions per second are randomly dropped, and the rest is stored.
Rate Limiting and Total Transactions
The ingestion pipeline has two kinds of rate limits that behave differently compared to organizations without dynamic sampling:
- High-level request limits on load balancers: these limits do not differentiate which data is sent by clients and drop requests as soon as the throughput from clients reaches the limit.
- Specific limits per data category in Relay: these limits apply once requests have been parsed and have gone through basic handling (see Sequencing above).
✨️ Note
There is a dedicated rate limit for stored transactions after inbound filters and dynamic sampling. However, it does not affect total transactions since the fidelity decreases with higher total transaction volumes and this rate limit is not expected to trigger since Dynamic Sampling already reduces the stored transaction throughput.
Client Side Sampling and Dynamic Sampling
Clients have their own traces sample rate. The client sample rate is a number in the range [0.0, 1.0] (from 0% to 100%) that controls how many transactions arrive at Sentry. While documentation will generally suggest a sample rate of 1.0, for some use cases it might be better to reduce it.
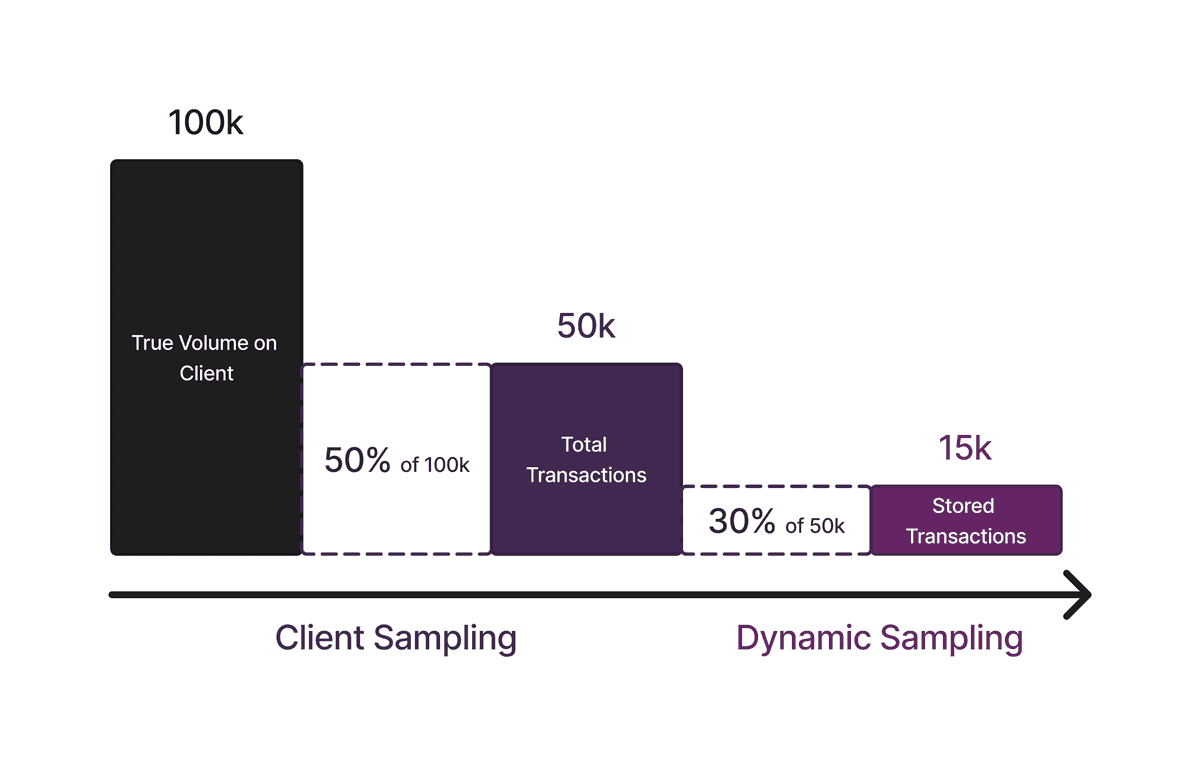
Dynamic Sampling further reduces how many transactions get stored internally. While many-to-most graphs and numbers in Sentry are based on total transactions, accessing spans and tags requires stored transactions. The sample rates apply on top of each other.
An example of client side sampling and Dynamic Sampling starting from 100k transactions which results in 15k stored transactions is shown below:

Total Transactions
To collect unsampled information for “total” transactions in Performance, Alerts, and Dashboards, Relay extracts metrics from transactions. In short, these metrics comprise:
- Counts and durations for all transactions.
- A distribution (histogram) for all measurements, most notably the web vitals.
- The number of unique users (set).
Each of these metrics can be filtered and grouped by a number of predefined tags, implemented in Relay.
For more granular queries, stored transaction events are needed. The purpose of dynamic sampling here is to ensure that enough representatives are always available.
💡 Example
If Sentry applies a 1% dynamic sample rate, you can still receive accurate TPM (transactions per minute) and web vital quantiles through total transaction data backed by metrics. There is also a listing of each of these numbers by the transaction.
When you go into transaction summary or Discover, you might want to now split the data by a custom tag you’ve added to your transactions. This granularity is not offered by metrics, so these queries need to use stored transactions.
If you want to learn more about Dynamic Sampling, continue to the next page.